I run four VPS and about twenty-five "projects": products with real users, pet projects, and infrastructure like MySQL, ClickHouse, backups, a Telegram Bot API server and relays in AWS. One Netdata parent watches all of it. The children stream metrics to it, it evaluates alerts and sends them to Telegram, and the critical ones to Pushover as well. I wrote about that part before.
One thing was missing: a single glance that answers "is everything fine right now?". A Telegram alert is an event, and an hour later it is buried under other messages. The Netdata dashboard has hundreds of charts per node; to see whether a bot is alive you have to remember where it runs and what its chart is called. I also wanted a public "all systems operational" page for my site that shows nothing of the internals.
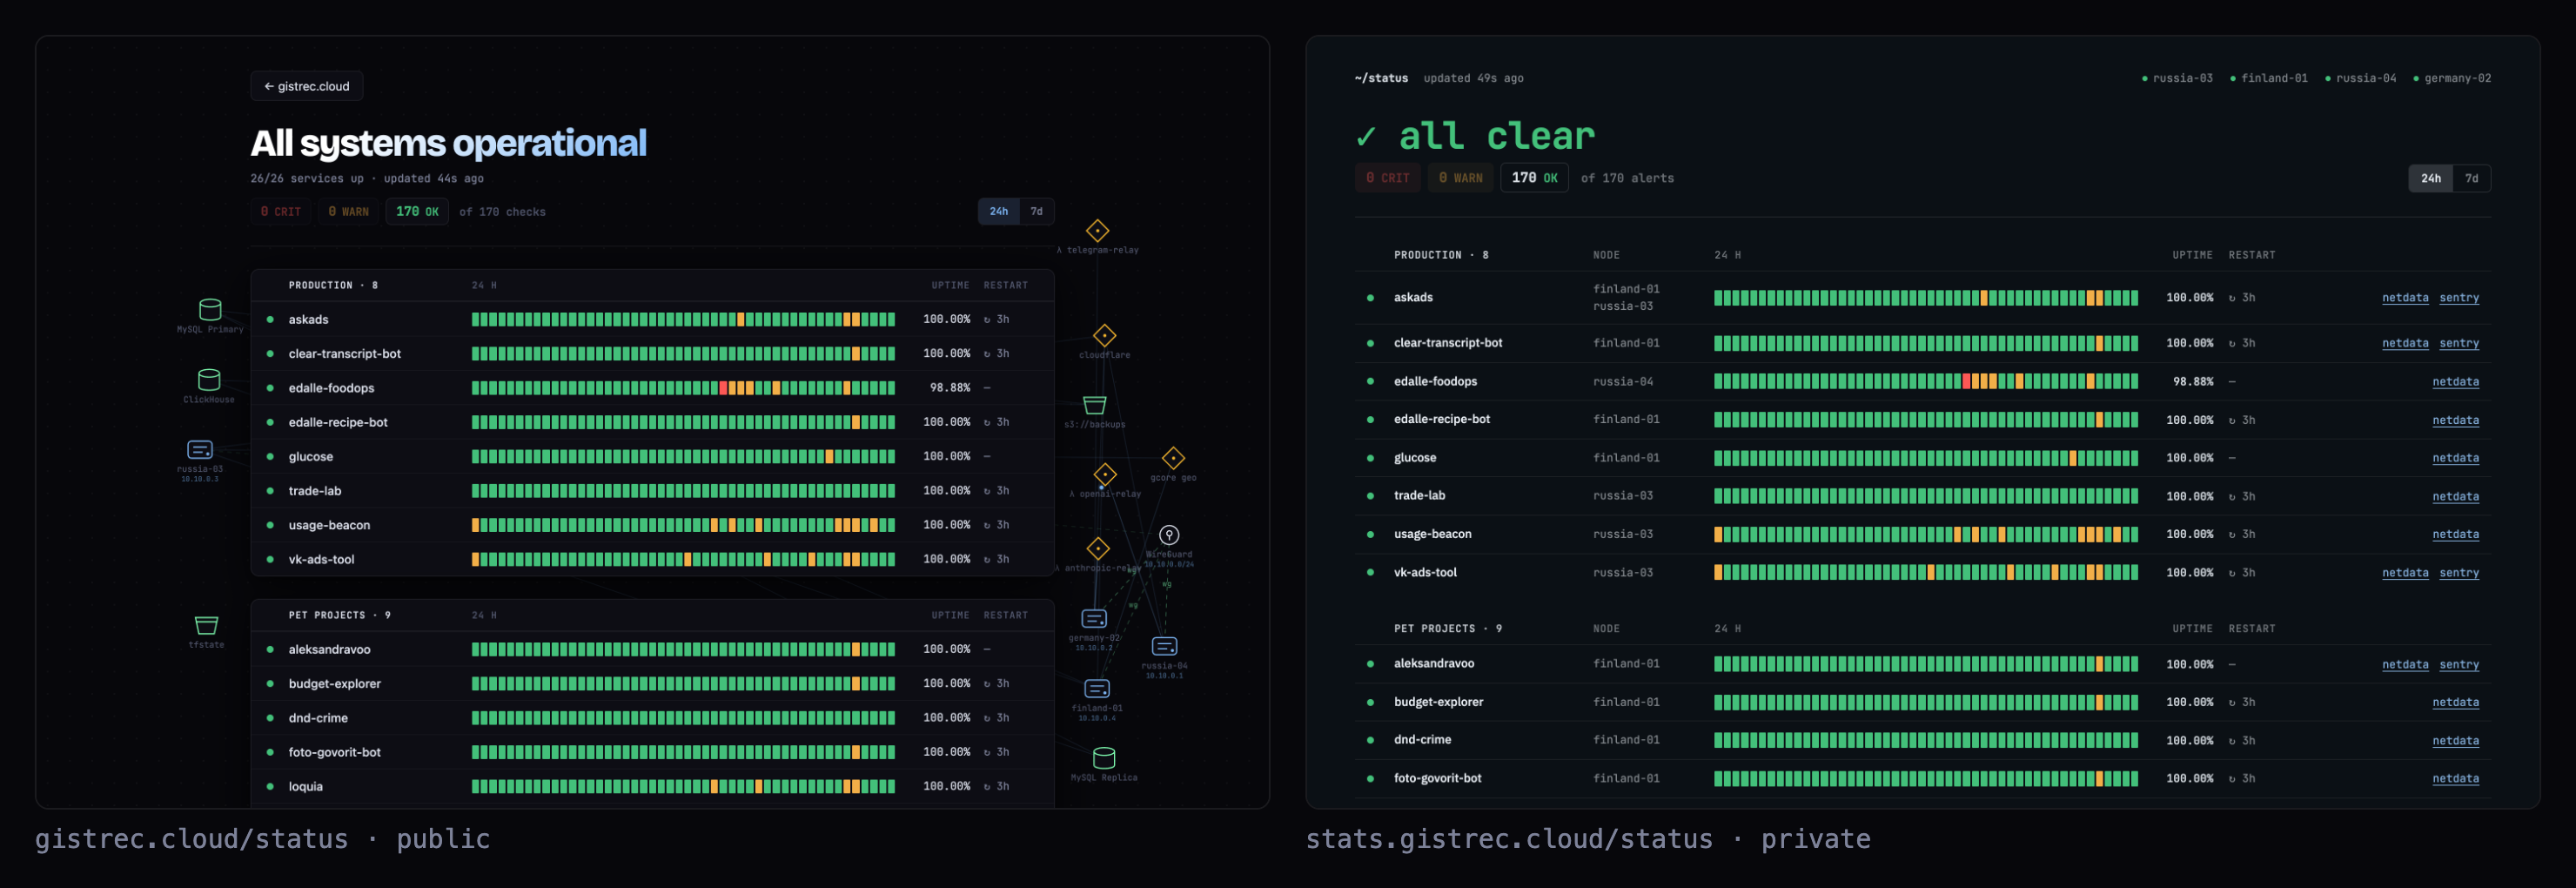
The result is two pages built from one data snapshot: a private stats.gistrec.cloud/status with alerts, nodes and links, and a public gistrec.cloud/status with only names, dots and history bars. Underneath are 372 lines of Python that poll the parent's API once a minute, and a systemd timer. No Netdata Cloud, no Grafana, no Prometheus.
What I already had
All my liveness checks are go.d jobs plus alert templates in health.d on the parent:
httpcheckon the apps'/healthendpoints (deep checks: the app queries MySQL/ClickHouse itself and returns 503 if the database didn't answer);portcheckwhere the port doesn't speak HTTP;pingto neighbouring nodes, and to finland-01 over two paths, WireGuard and the public address;filecheckon.last-successmarkers touched by the backup and S3 mirror scripts;x509checkon certificates right on disk;- the
mysqlandclickhousecollectors; - pm2 process groups in
apps.plugin, with onepm2_app_downtemplate for every group prefixedpm2_.
There is one rule: alert templates live only on the parent. It evaluates them against the charts its children stream, so one copy of a rule covers the whole fleet. Put the same file on a child and you get two notifications per event.
A typical file is a couple dozen lines:
# health.d/tg-bot-api.conf
# Telegram Bot API on finland-01: shared (tg_bot_api_shared, clients are RF bots
# over the tunnel) and the private ctb one (tg_bot_api_ctb). The root returns 404, which means "alive".
    template: tg_bot_api_down
          on: httpcheck.status
chart labels: _collect_job=tg_bot_api_*
       class: Errors
        type: Web Server
   component: Telegram Bot API
      lookup: average -2m unaligned of success
       units: ok
       every: 10s
        crit: $this < 0.5
       delay: down 2m multiplier 1.5 max 1h
          to: sysadmin
        info: Telegram Bot API ${label:url} fails half of its probes over 2 minutes, bots can't receive or send messages
Netdata already held everything a status page needs: the current state and the probe history. What it lacked was a view.
Attempt one: make do with the agent dashboard
My first idea was to write nothing. Netdata 2.x ships a built-in dashboard with "custom dashboards". Without signing in to Netdata Cloud they are limited. According to the docs (updated October 19, 2026) an anonymous user gets one custom dashboard per agent, and the local dashboard of an agent or parent is capped at five nodes. I have four, so the headroom is one node.
The limits weren't the real problem, though. I needed a table: project → state → history for a day and a week → where it runs → links. The agent dashboard thinks in charts and nodes. Netdata has no notion of a "project" at all, so I had to derive one.
That settled the requirements for my own page:
- No second probing system. The source of truth is the parent's alerts; the page shows exactly what alerting sees and nothing more.
- The public version reveals nothing beyond project names and their state.
- No new services: stdlib Python, static HTML, and the nginx that is already there.
Where a "project" comes from
The parent knows its children: GET /api/v1/info returns mirrored_hosts. Each host's alerts sit behind its own prefix, /host/<name>/api/v1/alarms; for the parent itself the prefix is empty.
First gotcha: GET /api/v1/alarms without parameters doesn't return alerts in the CLEAR state. To get all of them you need ?all. Without it the script happily reports there are no alerts, which is a lie.
Next, how to group two hundred alerts into projects. Every alert in the response has a source field with the path of the file it was loaded from. And I already keep one file in health.d per project. So a project is a file name:
def project_of(a):
    for rx, row in EXTERNAL_CHARTS + INFRA_CHARTS:
        if re.search(rx, a['chart']):
            return row
    m = re.search(r'file=/etc/netdata/health\.d/([^,]+)\.conf', a.get('source') or '')
    if not m:
        return None
    key = m.group(1).lower().replace('_', '-')
    for rx, row in INFRA_FILES:
        if re.search(rx, key):
            return row
    if a['name'].startswith('host_clock_'):
        return 'VPS'
    if key in ('pm2', 'pm2-memory'):
        c = re.match(r'^app\.pm2_(.+)_(processes|mem_usage)$', a['chart'])
        if not c:
            return None
        key = c.group(1).lower().replace('_', '-')
    return ALIASES.get(key, key)
The first check is for a group I didn't have at the start: external APIs that askads depends on (Yandex Direct, Metrica, Wordstat, Webmaster, VK Ads). askads probes them itself without a token, so series can take two chart dimensions at once (success,no_connection): if askads itself didn't answer, the bucket counts as "no data" rather than as the other API failing. An outage of someone else's API isn't ours, so it can turn the page header yellow at most.
The exceptions in this function are the entire "business logic":
- pm2 alerts come from a single
pm2.conffor all apps, so the project name is taken from the chart nameapp.pm2_<app>_processes; - infrastructure files (
mysql,clickhouse-down,s3-mirror,tg-bot-api,lambda-relay,fleet-*) fold into the rows "MySQL", "ClickHouse", "S3 Backups", "Network", "VPS" through a table of regexes; x509check_*andportcheck_k3s_*charts go to the "TLS" and "k3s" rows regardless of the file;- alerts from Netdata's stock files (
project_ofreturnedNone) reach the page only while they fire, in the "VPS" row. Otherwise the page would drown in dozens of green system alerts from every node.
Keys with a suffix, like askads-cloud, trade-lab-clock or dnd-crime-api-staging, are folded by merge_prefixes() into the shortest existing prefix: they are parts of the projects askads, trade-lab, dnd-crime. Alerts of nodes I've deleted stay on the parent with a frozen last_updated; those are dropped once they're older than an hour (STALE_SEC = 3600).
The row kind (infra, prod or pet) comes from the netdata_projects_prod list in host_vars. The kind drives the verdict in the header: a pet project's WARNING and stock WARNINGs show up in the counters but don't spoil the "all clear" title. That's the state at the time of writing: 3 WARNINGs in the snapshot, verdict green.
History without alarm_log
I expected the state history to come from GET /api/v1/alarm_log, which holds alert transitions. On October 23, on a parent running Netdata 2.11, it returned an empty response, zero bytes. The same day I upgraded the parent to 2.12.1 and the log started working, but for the page that changes nothing. On October 28 it returned exactly 1000 entries, the oldest from 38 hours earlier: the log keeps the last thousand transitions, which isn't enough for a week. 2.12.1 also has /api/v2/alert_transitions (one day on the parent: 141 WARNING, 141 CLEAR, 2 CRITICAL), but those are the same status transitions. They can't give you the main thing: what share of checks in a bucket passed.
Netdata has the history anyway, just not in the alert log but in the probe charts themselves. Every probe is a chart with history, and GET /api/v1/data can return it already aggregated:
RANGES = {'24h': (86400, 48), '7d': (604800, 42)}

def series(parent, host, chart, dim, group, rng):
    after, points = RANGES[rng]
    q = urllib.parse.urlencode(dict(chart=chart, after=-after, points=points, group=group,
                                    format='json', dimensions=dim))
    d = get(f'{base(host, parent)}/api/v1/data?{q}')
    rows = list(reversed(d['data']))
    if ',' in dim:  # several dimensions: a bucket becomes {dimension: value}
        vals = [None if all(x is None for x in r[1:]) else dict(zip(d['labels'][1:], r[1:])) for r in rows]
    else:
        vals = [r[1] for r in rows]
    v = ([None] * max(0, points - len(rows)) + vals)[-points:]
    return v, [r[0] for r in rows]
A day is 48 buckets of 30 minutes, a week is 42 buckets of 4 hours. Netdata does the aggregation (average, max, min) itself; the script only maps values onto one scale: 1 is normal, about 0.96 is a warning, 0 is critical. Each probe type has its own chart and its own normalization:
| Probe | Chart | Dimension, aggregation | What 1 means |
|---|---|---|---|
| httpcheck / portcheck | httpcheck_<job>.request_status, portcheck_<job>_status | success, average | every probe in the bucket succeeded |
| ping | ping_<job>.host_packet_loss_* | loss, average → 1 - loss/100 | no loss |
| mysql / clickhouse | mysql_<job>.queries, clickhouse_<job>.uptime | any value → 1, gap after the first point → 0 | the collector got data |
| filecheck | filecheck_<job>.file_modification_time_ago | mtime_ago, max → by the alert thresholds | marker is fresher than the warn threshold |
| x509check | x509check_<job>.cert_depth0_time_until_expiration | expiry, min → 1 / 0.96 / 0 | more than 14 days until expiry |
| pm2 (if no probes) | app.pm2_<app>_processes | processes, min → > 0 | the process was alive the whole bucket |
Databases get special treatment. For mysql_down and clickhouse_down the alert is "the last collection is older than a minute" ($now - $last_collected_t). So in the history a gap in the data after the first point means "the server didn't answer" rather than "no data", which is the gap_down flag. The filecheck thresholds match the alerts: 30/50 hours for daily backups, 13/25 for the S3 mirror that runs every 6 hours.
A project can have several probes (loquia has three /health endpoints, one per process). Each bucket takes the worst one:
merged, bad = [], []
for i in range(points):
    vals = sorted((r[i], k) for k, r in enumerate(rows) if r[i] is not None)
    merged.append(vals[0][0] if vals else None)  # the worst probe in the bucket
    # every probe below normal, worst first: [index into labels, value]
    bad.append([[k, round(x, 4)] for x, k in vals if x < OK_FROM] or None)
# a yellow bucket is degradation, not downtime: it counts as full in uptime
known = [1 if x >= WARN_FROM else x for x in merged if x is not None]
return dict(v=[None if x is None else round(x, 4) for x in merged], t=t, w=bad, labels=labels,
            uptime=round(sum(known) / len(known) * 100, 2) if known else None)
The page colours each cell: >= 0.999 (OK_FROM) green, >= 0.95 (WARN_FROM) yellow, below that red, None grey. Besides the worst value, every bucket keeps a list of all probes below normal, which the tooltip over the cell shows. The "uptime" to the right of the bar is the average over known cells, and a yellow cell counts as full: a short failure of one probe is degradation, not downtime. This isn't uptime in the SLA sense, and I picked the 0.999/0.95 thresholds by eye.
Fresh charts were a separate surprise. When I added a new probe, it returned "no data" for the 24h and 7d windows: the aggregated storage tiers are still empty while data accumulates. An empty response becomes a row of None, so grey cells. If the chart doesn't exist at all yet, the request fails with an error, so every probe is wrapped in try/except and skipped on error: one probe without a chart shouldn't take down the whole row.
Here is what it looked like on October 23 on the mysql_local.queries chart, a few minutes after the collector was enabled. The one-day window is empty, the last ten minutes have data:
GET /api/v1/data?chart=mysql_local.queries&after=-86400&points=48&group=average&dimensions=queries&format=json
{"labels":["time","nodata"],"data":[]}

GET /api/v1/data?chart=mysql_local.queries&after=-600&points=3&dimensions=queries&format=json
{"labels":["time","queries"],"data":[[1792753800,46.5084614],[1792753600,null],[1792753400,null]]}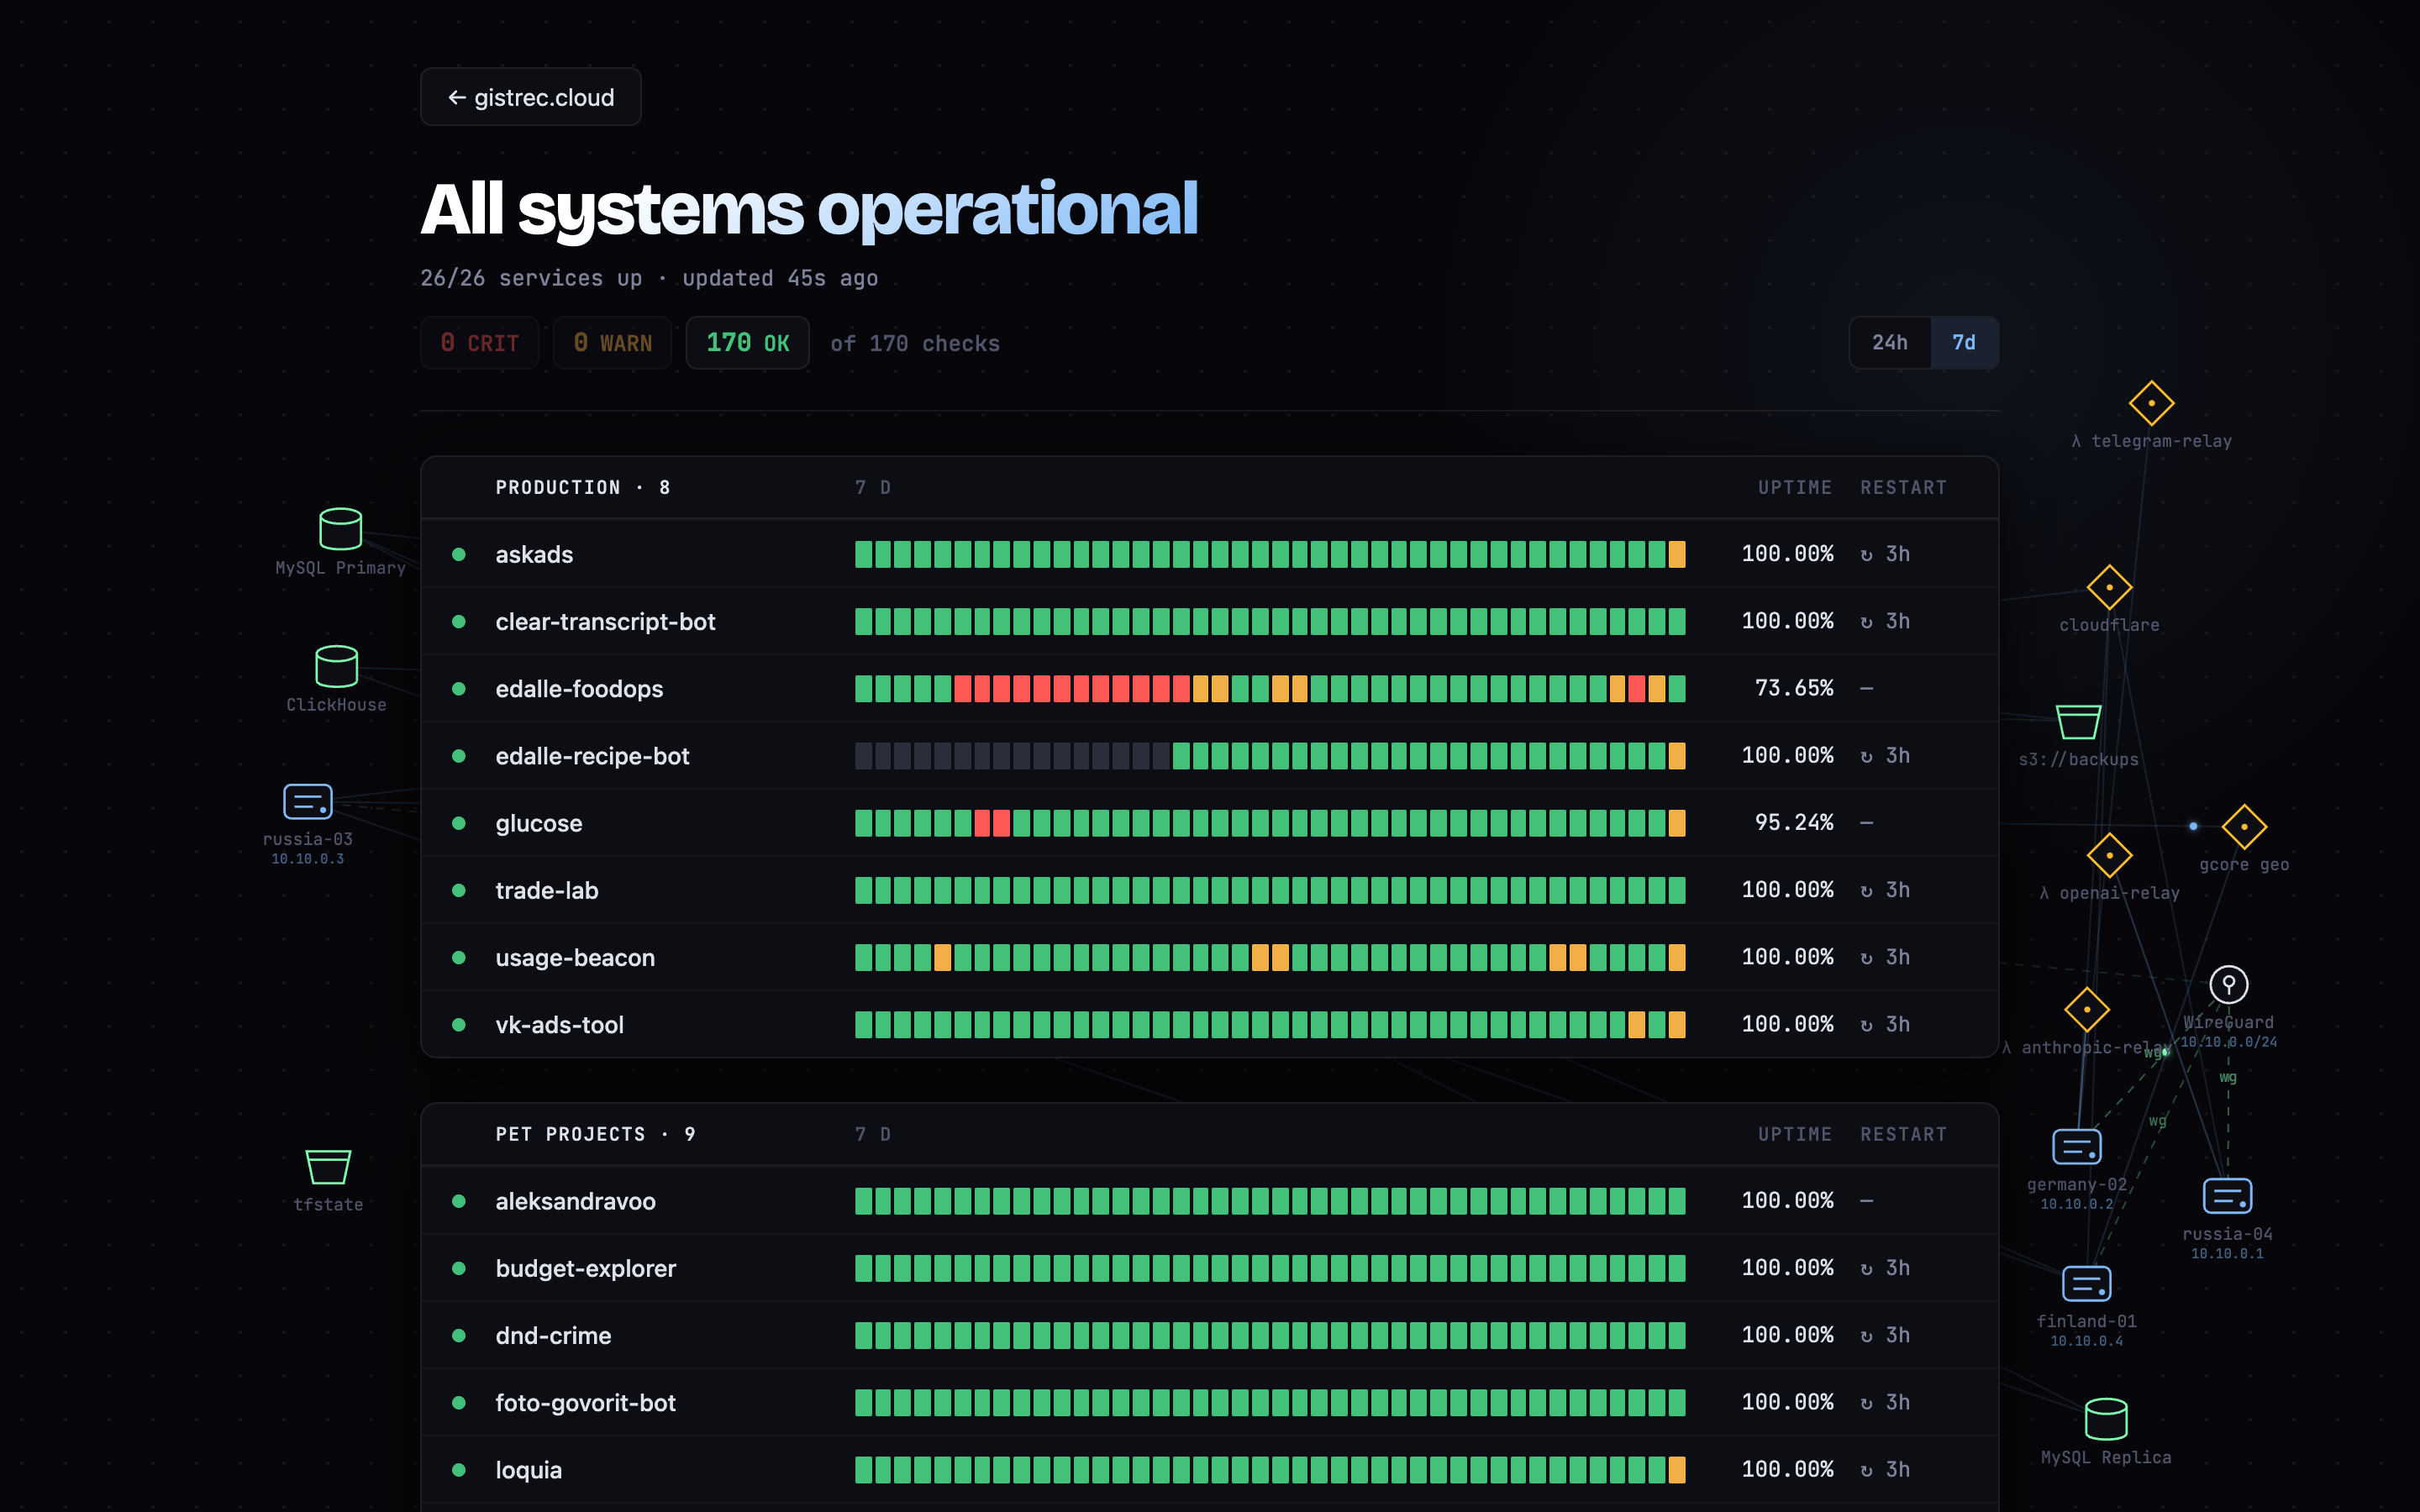
Time semantics: the timestamp is the end of the bucket
In the /api/v1/data response every point has a timestamp, and it marks the end of an already closed bucket, not its start or middle. I learned this from the page, not from the docs. The last cell of a bar describes the last closed 30 minutes; there is no "current interval" in it.
On the page it looked like this: the project's dot is yellow (an alert is firing) while the whole bar is green, because the alert has been firing for three minutes and the bucket closed before that. It looks like a bug.
The fix is to raise the last cell to the colour of the current alert and say "firing now" in the tooltip:
// the current bucket is never lighter than the row's live alerts: otherwise the dot is yellow and the bar green
const NOW_CLS = { warn: 1, crit: 2, outage: 3 };
function histCell(p, dot) {
  const h = p.history[state.range];
  const n = RANGES[state.range].points;
  if (!h) return { bars: '<i></i>'.repeat(n), uptime: '—' };
  const cls = h.v.map(bucketCls);
  const lifted = (NOW_CLS[dot] || 0) > (NOW_CLS[cls[n - 1]] || 0);
  if (lifted) cls[n - 1] = dot;
  ...
}
In the tooltip the bucket bounds are counted back from the timestamp: end - step … end. If the timestamp is in the future (the bucket is still running), the label is "current interval"; if the cell was raised, "firing now"; otherwise how long ago, in words ("9 hours ago"). Below that come the probes that were below normal in this bucket, each with its status.

Restarts: pm2 uptime instead of deploy time
I wanted a "last deployed" column. Netdata knows nothing about deploys. But apps.plugin exposes an app.pm2_<app>_uptime chart for every pm2 group. I take the latest value for each of the project's groups and the minimum of those:
def restart(parent, alarms):
    ups = []
    for a in alarms:
        if m := re.match(r'^app\.pm2_(.+)_processes$', a['chart']):
            try:
                d = get(f"{base(a['host'], parent)}/api/v1/data?chart=app.pm2_{urllib.parse.quote(m[1])}_uptime"
                        '&after=-60&points=1&format=json')
                if d['data'] and d['data'][0][1] is not None:
                    ups.append(d['data'][0][1])
            except Exception:
                pass
    return min(ups) if ups else None
In the row it shows as "↻ 4d". The trade-off is obvious: a deploy and a crash with an automatic restart look the same. But I usually look at the page right after a deploy, so that's enough for me.
Public and private: two JSON files instead of an API proxy
The simplest way to build a public page is to expose the parent's API through nginx. I dropped that idea almost immediately. Through /api/v1/data you can read any chart of any node. Alert info strings get labels like ${label:url} substituted in, which means internal probe addresses. Filtering that at the nginx level is a leaky exercise by design.
So a snapshot sits between the API and the browser. Once a minute status-snapshot collects everything into one dictionary and writes two files: the full one for the private page and a trimmed one for the public page:
def public(snap):
    """Only names, statuses, history and restarts go out: no nodes, alerts or links.
    Probe labels in the history are short (public_label)."""
    # hist(): probe labels are shortened to "health check", "TLS cert", "network link",
    # without nodes or project prefixes (public_label); identical ones are merged

    def strip(p):
        hot = any(RANK[a['status']] >= 2 for a in p['alarms'])
        dot = 'outage' if p['outage'] else CLS[p['worst']] if hot else 'nodata' if all(RANK[a['status']] == 1 for a in p['alarms']) else 'ok'
        return dict(name=p['name'], kind=p['kind'], dot=dot, restart=p['restart'],
                    history={rng: hist(h, p['name']) for rng, h in p['history'].items()})
    return dict(generated_at=snap['generated_at'], public=True, summary=snap['summary'],
                projects=[strip(p) for p in snap['projects']])
outage is a state I added later. Every project has required alerts: by default pm2_app_down, mysql_down, clickhouse_down, *_health_down and *_healthcheck, and some projects have their own list in the config. If any of them is CRITICAL, the project is down entirely, and the page shows DOWN instead of a red dot. Two prod projects in that state at once turn the header into "Major outage".
The public JSON has no node names, no alert texts and no links: just the project name, kind, dot colour, pm2 uptime, two history bars, plus the overall summary and the snapshot time. It is written atomically, through a temp file and os.replace, so the page never reads half a file.
The timer and the unit are plain systemd, sandboxed as far as a oneshot script allows:
# status-snapshot.timer
[Timer]
OnCalendar=minutely
AccuracySec=5s

# status-snapshot.service
[Service]
Type=oneshot
ExecStart=/usr/local/sbin/status-snapshot /etc/status-snapshot.json
Nice=10
ProtectSystem=strict
ReadWritePaths=/var/www/stats /var/www/status-public
PrivateTmp=true
NoNewPrivileges=true
nginx has two location blocks. The private one sits behind auth_request; the public one is just an alias to the file with caching disabled:
# stats.gistrec.cloud: private
location = /status.json {
    auth_request /_auth/check;
    error_page 401 = @fleet_login;
    expires epoch;
    alias /var/www/stats/status.json;
}

# gistrec.cloud: public
location = /status.json {
    expires epoch;
    alias /var/www/status-public/status.json;
}
The public page itself lives in the site's repository; the Netdata role doesn't know about it and only serves the JSON. The site's home page reads the same JSON: the "All systems operational" button in its header is the same snapshot.
Both pages re-read status.json every 30 seconds and show the snapshot's age. If it's older than three minutes (the timer or the parent has stopped), the counter turns red. On the private page the verdict colour is mirrored in the favicon, so the state is visible from a background tab.
On the private page the fonts are embedded in the HTML as base64. Google Fonts loads from Russia every other time, and a status page that hangs while loading a font is a bad status page.
Gotchas
The database collectors gave up before their users existed
After the first deploy to a fresh host, the mysql and clickhouse collectors didn't come up. The cause was role order in the playbook. The netdata role is in the baseline play for every host, while the mysql and clickhouse roles are in a separate, later play:
111:- name: Baseline for every host (monitoring)
169:    - role: netdata
204:- name: Database servers — self-hosted MySQL + ClickHouse (Docker)
215:    - role: mysql
221:    - role: clickhouse
The go.d collector starts, tries to connect as the netdata user that doesn't exist yet, fails autodetection and never tries again: autodetection_retry defaults to 0. The fix is one line in the job template:
jobs:
{% for job in netdata_mysql_jobs %}
  - name: {{ job.name }}
    dsn: '{{ job.dsn }}'
    # DB user is created later in the play (db roles run after netdata)
    autodetection_retry: 60
{% endfor %}
Same story with x509check: the certificates are issued by the tls role in a later play, so on a fresh host the file isn't there yet. It got autodetection_retry: 60 too.
Alerts don't appear right after a restart
Netdata's health engine instantiates alerts about a minute after the agent (re)starts. A snapshot taken during that minute sees fewer alerts than there are, and that's not a bug in the script. After deploying the role, which restarts the agent, the page slims down for a minute, and I've got used to it.
Ghost nodes
Alerts of a removed node don't disappear from the parent on their own; they stay with a frozen last_updated. Until I added the age cutoff, the page kept a row for a host that no longer existed.
Links from Telegram led nowhere
This isn't about the page, but it's from the same "no Cloud" series. Links in Netdata alerts go through the registry: registry-alert-redirect.html is supposed to find the agent by machine GUID. On 2.11 the built-in dashboard never calls action=access, without which the resolver doesn't work, so the link always ended at "Can't find any Netdata Agent". I replaced the resolver with a location = /registry-alert-redirect.html in nginx that does a 302 to the alert page under /host/<name>/ on the parent. Same idea as the status page: Netdata stores the data, and it's easier to present it with my own tools.
The result
In the screenshots (October 27, 2026) the public page shows 26 services: 9 infrastructure, 8 product and 9 pet projects. They account for 170 alerts, none firing, and the verdict is "All systems operational". The public JSON is about 57 KB.
The most telling row is "Network". On October 23 it had 99.92% for the day and 99.77% for the week. These are ping probes between nodes, including the Russia↔Europe link, which flaps regularly and which the link_* alerts report to Telegram. Now it shows in the history too, not only in the notification feed.
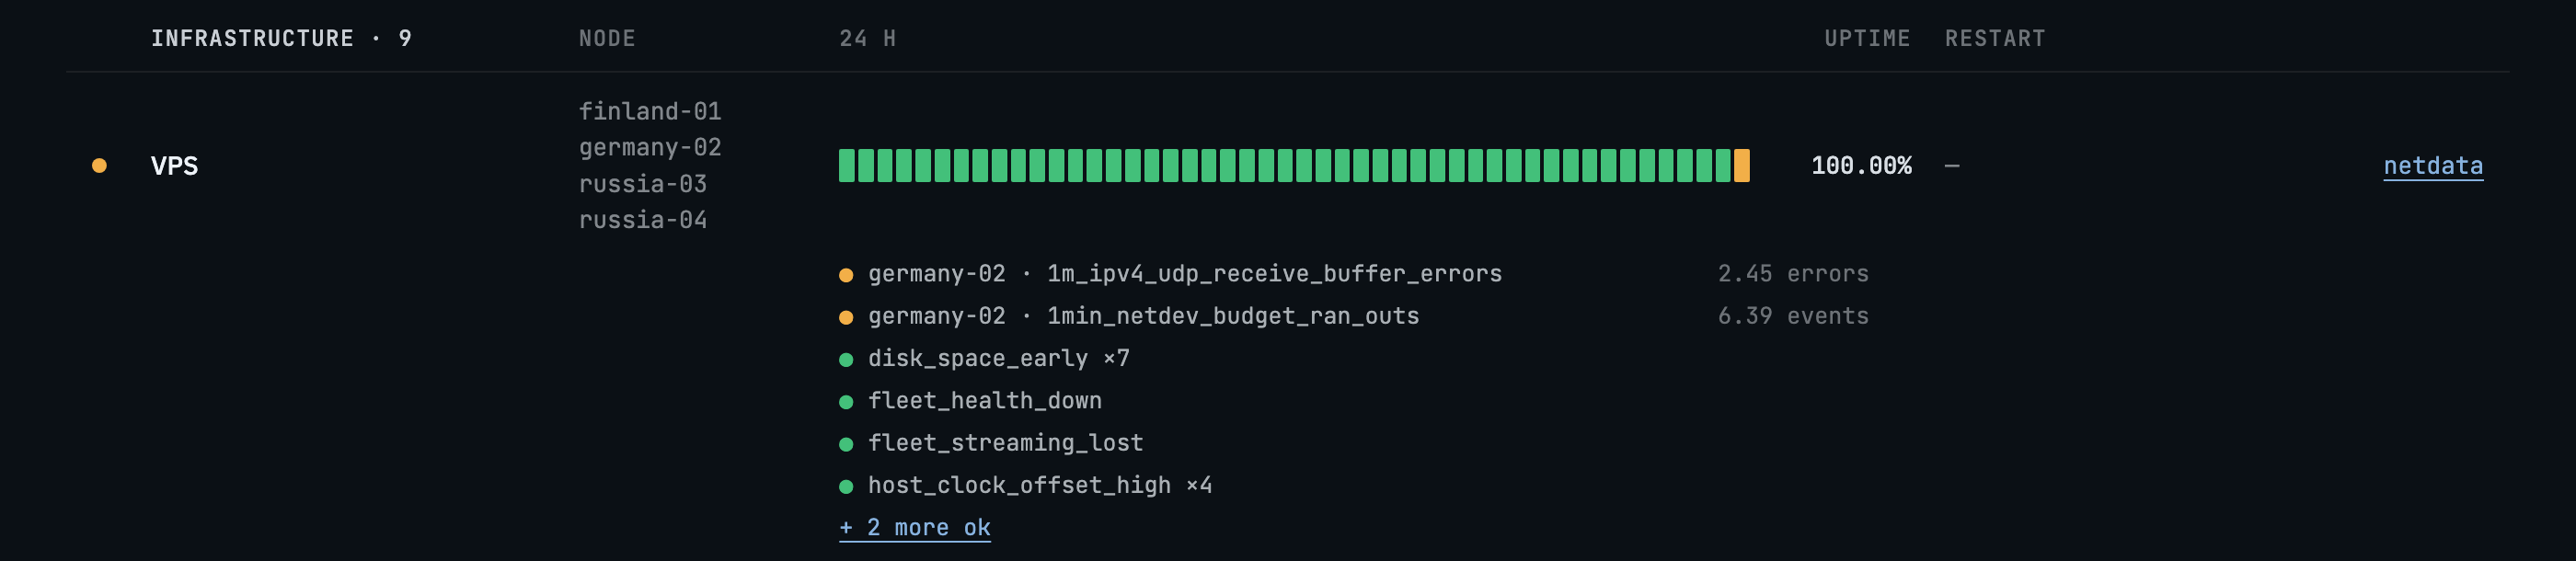
disk_space_early ×7).One snapshot run on the parent takes about half a second and makes 172 API requests: 1 to info, 4 to alarms (one per node) and 167 to data (measured October 28).
What I'd do differently
The page and the parent live on the same VM. If it dies, the alert about it will come from another node (there's a reverse fleet-watch probe there), but the public page will simply freeze with a red "updated 10m ago". For an honest status page the public JSON should go to external storage or a second host. I haven't done that yet.
"Project = file name in health.d" is a handy convention, but a load-bearing one: rename a file and a new row appears on the page while the old one disappears together with its history. The code won't warn you.
A full recompute once a minute is a simple solution, and at 26 services it doesn't hurt: 172 requests and half a second. Each run is alarms?all for every node, two /api/v1/data requests per probe (24h and 7d) and one more per pm2 group. I didn't make the history incremental because there was no reason to.
Netdata had collected all the data for a status page long before I wanted one. It took 372 lines to show it.