I keep a small infrastructure: 5 VPS, MySQL and ClickHouse clusters. On them run pet-projects and small products like VkAdsTool and ClearTranscriptBot. There are real users for whom stability matters.
Services rarely die instantly. Usually they first degrade: start swapping under load, RAM Usage gradually grows by a few megabytes per hour, because of a noisy neighbor on a shared host i/o latency can grow all the way up to 500 ms. But by the time the "service is down" alert comes in, the incident is already affecting users.
I use Netdata on my servers for a long time now, and more than once it helped me see the signs of degradation before it became too late. In the article I'll tell how I use it: install, configs, alerts, how to look at metrics from all servers in one place, and three real cases where Netdata saved me from downtime.
What I want from monitoring
From monitoring I need one thing: when at 3 a.m. something broke, in five minutes to understand what exactly degraded and from what moment. The rest I'll figure out, but those five minutes are critical.
For that I need metrics on:
- CPU per core, separately system / user / iowait.
- Memory pressure, swap-in / swap-out.
- Disk: throughput, IOPS, queue length, errors.
- Network: throughput, retransmits, packet drops.
- Health of services: nginx, Postgres, MySQL, Redis, Docker, systemd units.
- Alerts that help to notice a problem in time, not dozens of dashboards I rarely look at.
Why Netdata specifically
Usually people put Prometheus + Grafana for this. But in my infrastructure Netdata was more convenient because of a different set of trade-offs:
- Install with one command.
kickstart.sh, and in a few minutes the agent already collects basic server metrics. - Modest resource usage. Netdata stays a pretty lightweight agent: on mine it eats around 50–100 MB of RAM and 1–5% CPU.
- Metrics with 1-second resolution. When metrics are aggregated at 10–30 second intervals, a short 4-second spike easily gets lost in the averaging. With 1-second resolution Netdata keeps it visible.
- Automatic discovery of local services. If Nginx, Postgres, Redis, Docker or systemd are on the same machine where the Netdata agent is installed, metrics often appear automatically after the agent restarts.
- Alerts out of the box. Basic alerts for CPU, RAM, disk, swap, load average and other typical problems are already configured. After that you just adapt the thresholds to your infrastructure.
When Netdata caught what would have become an incident
Below are three concrete stories. These aren't problems that are well visible by a healthcheck. By the time the "service is up" indicator goes red, users are already facing the consequences.
Case 1. A memory leak that was piling up for a week
Backstory. At some point I get a message from a client that the service doesn't work. Quickly SSH in, don't find the service process, look in journalctl and see the unpleasant OOM Killed. Quickly restart and go look in the code to find the problem.
Wrong assumption. Of course, I didn't want to dig in old code for long, so I just assumed that the user uploaded a very big file into the service (one that gets fully loaded into RAM), for which there wasn't enough memory. So I just put a limit on the size of uploaded file.
Did it help? Of course not! On the contrary, it made things worse: I started watching the service uptime less, assuming there definitely won't be any error now.
How it ended. After yet another crash I found a banal problem in the python code: was saving data into an array, but didn't clean them up. If I had been using Netdata, I would have immediately noticed the slow but steady growth of RAM Usage.
Case 2. Noisy neighbor on a shared disk
Preamble. A simple backend on a VPS started slowing down at random moments. No errors anywhere, neither in the logs nor in system messages.
What I saw in Netdata. Unlike the previous stories (when I didn't have a metrics dashboard yet) I immediately saw that disk.iops and disk.await flew to the moon, but the VM's own disk.io stayed small. Looks like the problem wasn't in my service, but in a noisy neighbor on the shared host loading the common disk.
What helped. Wrote to support and they moved my service to another host. Plus fixed the i/o alert settings (confession: I had just turned them off).
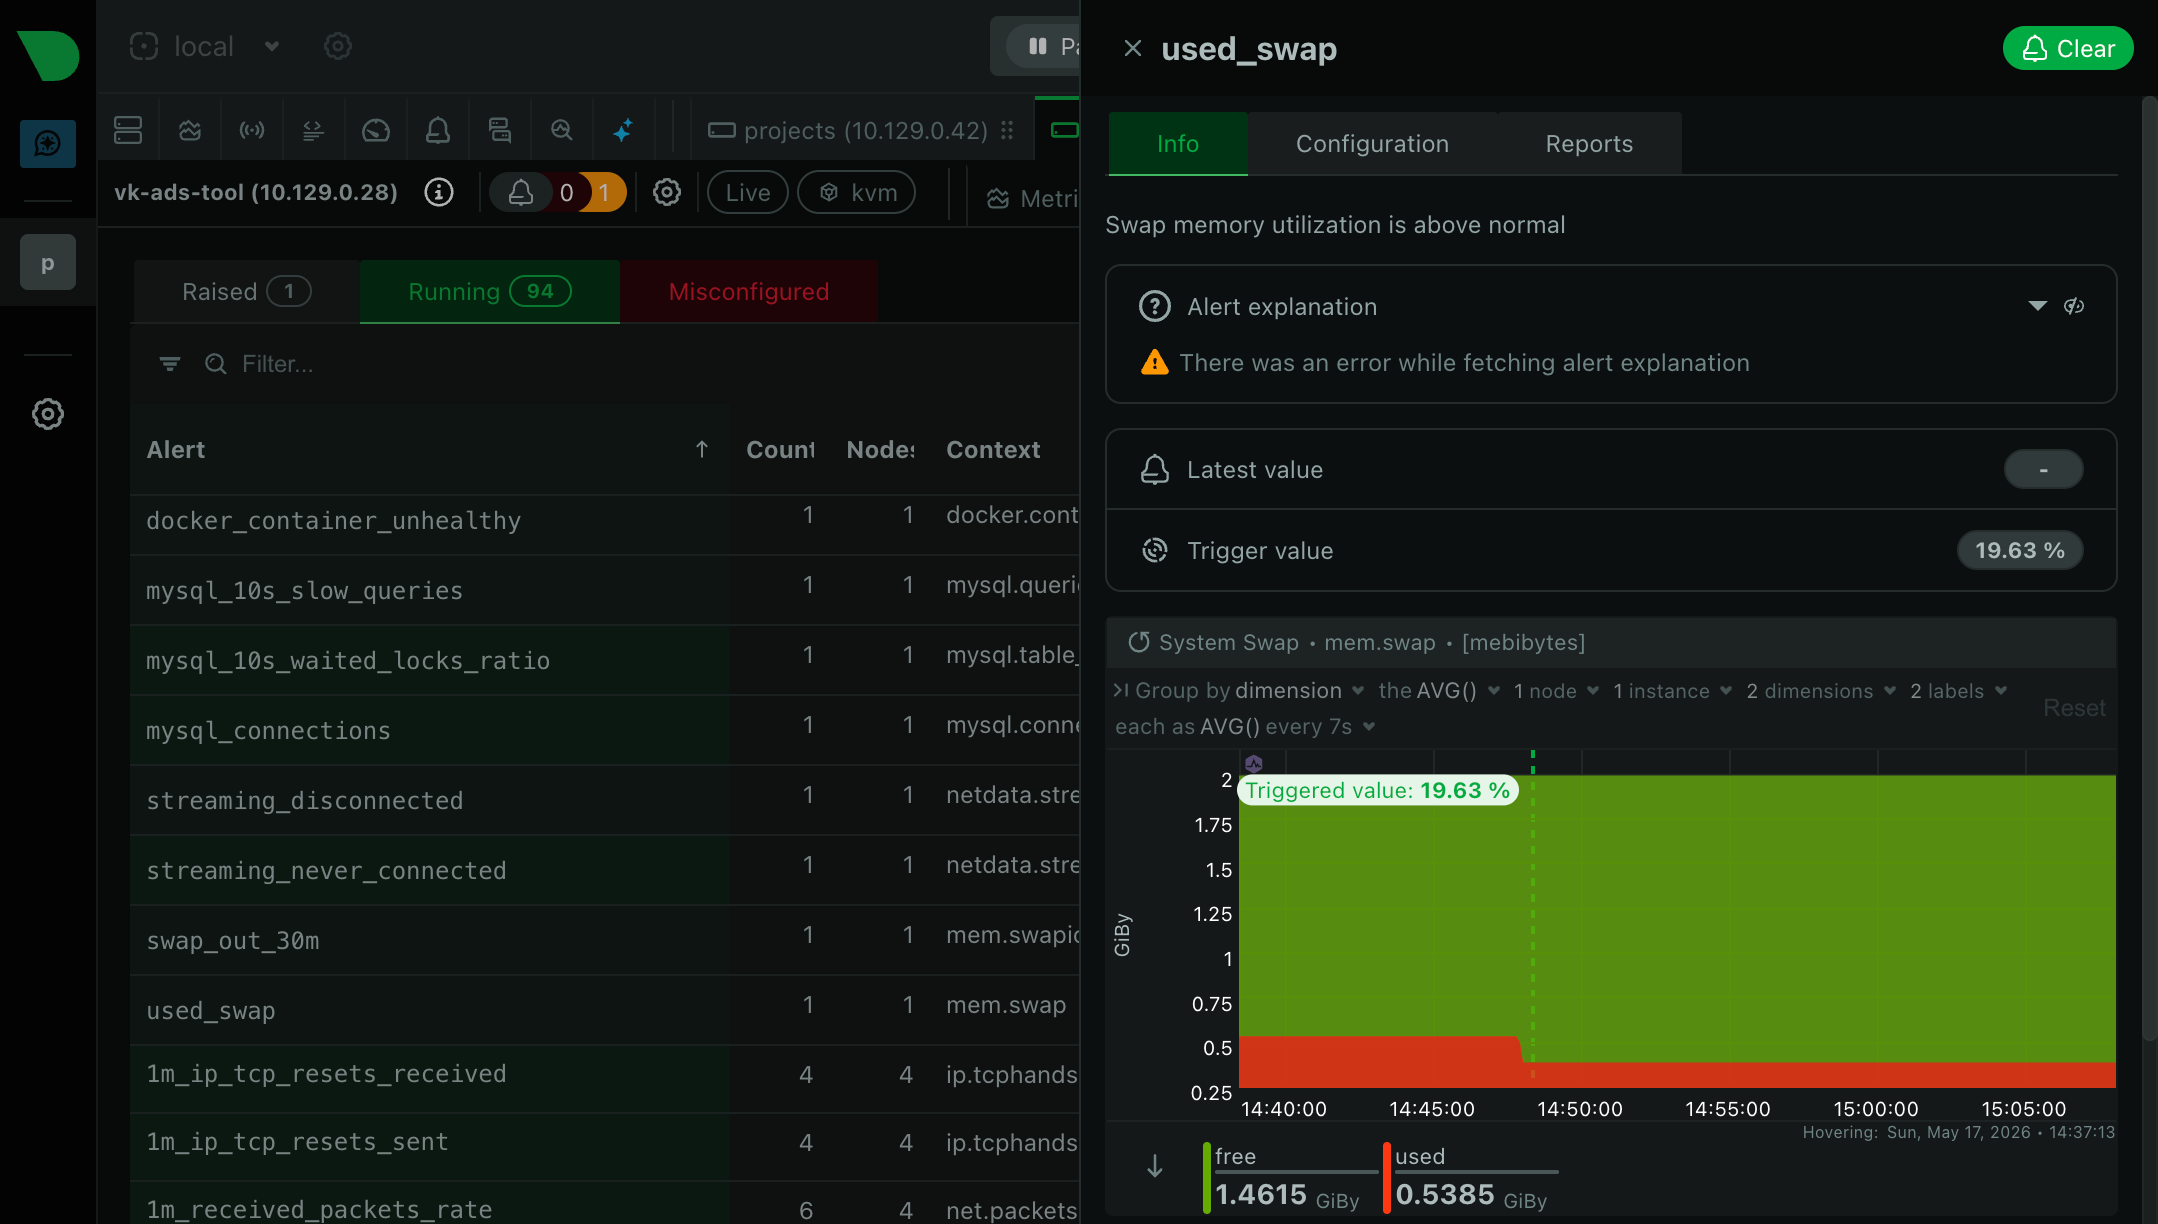
Case 3. Gradual growth of swap usage
How it all started. A more complex backend started returning random 500s. The latency dashboard showed an elevated p95 without an obvious cause. There was still plenty of free CPU. The first instinct was simple: restart the service and see if it repeats. But this is exactly the case when a restart would have masked the cause.
What Netdata showed. On the mem.swapio chart I saw that during the last 36 hours swap-out was gradually growing. There was almost no free memory left. CPU looked normal, but actually the processor was often waiting on disk: the system was spending time not on useful work, but on constantly exchanging memory pages with swap.
Fix. In a previous service config update one of the parameters was increased 5×, but there was no memory headroom left on the server. Even small additional allocations started going into swap. Rolled back the config and added two alerts: on system.ram available_percent < 15 and on mem.swapio out > 1MB/s for 5 minutes. Now such degradation is visible in advance.
Quick start: minimal safe install
If you're trying it right now on one server, here's my path.
1. Install the agent. The official install script will detect the distribution itself and set up Netdata to run via systemd.
# install in one line (Linux)
wget -O /tmp/netdata-kickstart.sh https://get.netdata.cloud/kickstart.sh
sh /tmp/netdata-kickstart.sh --stable-channel --disable-telemetry
2. Close access to the dashboard. By default the Netdata dashboard on port 19999 is available without login and password. If this port is open, the metrics can be viewed by anyone who knows the server's address. So I bind Netdata to localhost and proxy access through nginx with basic auth.
[web]
    bind to = 127.0.0.1
Install the htpasswd utility and create a user (for example, stats):
sudo apt install apache2-utils
sudo htpasswd -c /etc/nginx/.htpasswd stats
Add a new location to the nginx config that proxies to the local Netdata and requires basic auth:
location /netdata/ {
    proxy_pass http://127.0.0.1:19999/;

    auth_basic "Restricted";
    auth_basic_user_file /etc/nginx/.htpasswd;

    proxy_set_header Host $host;
    proxy_set_header X-Real-IP $remote_addr;
}
Reload nginx, and the dashboard is available at https://your-domain/netdata/ behind login and password:
sudo systemctl reload nginx3. Notifications in Telegram. For one person, Telegram is more convenient than other channels: the alert arrives instantly, you see it right on the locked screen, it doesn't get lost in mail. Sets up in a couple of minutes.
First we create a bot: write to @BotFather, send /newbot, come up with a name, and in the reply there will be a token like 1234567890:AAA.... The chat ID we take through @userinfobot: it's enough to send any message to it.
Next we put both values into the notifications config:
SEND_TELEGRAM="YES"
TELEGRAM_BOT_TOKEN="1234567890:AAA..."
DEFAULT_RECIPIENT_TELEGRAM="123456789"
Send a test message to make sure the alerts arrive:
sudo netdatacli reload-health
sudo -u netdata /usr/libexec/netdata/plugins.d/alarm-notify.sh test
4. Cut the extra noise and load. By default Netdata shows a lot of metrics, but not all of them are needed every day. I disable the extra plugins and tune the alert thresholds to my infrastructure, so notifications don't spam the alert chat I'd just end up muting.
For example, I disable what I definitely won't use:
[plugins]
    # Very greedy, only needed for deep kernel tracing
    ebpf = no
    # Low-level CPU profiling
    perf = no
    # Reads logs, extra load
    systemd-journal = no

    # OpenTelemetry not needed (already have Sentry)
    otel = no
    otel-signal-viewer = no
    network-viewer = no

    # Low-level kernel metrics, almost never needed
    nfacct = no
    slabinfo = no
    debugfs = no
How to look at metrics from all servers in one place
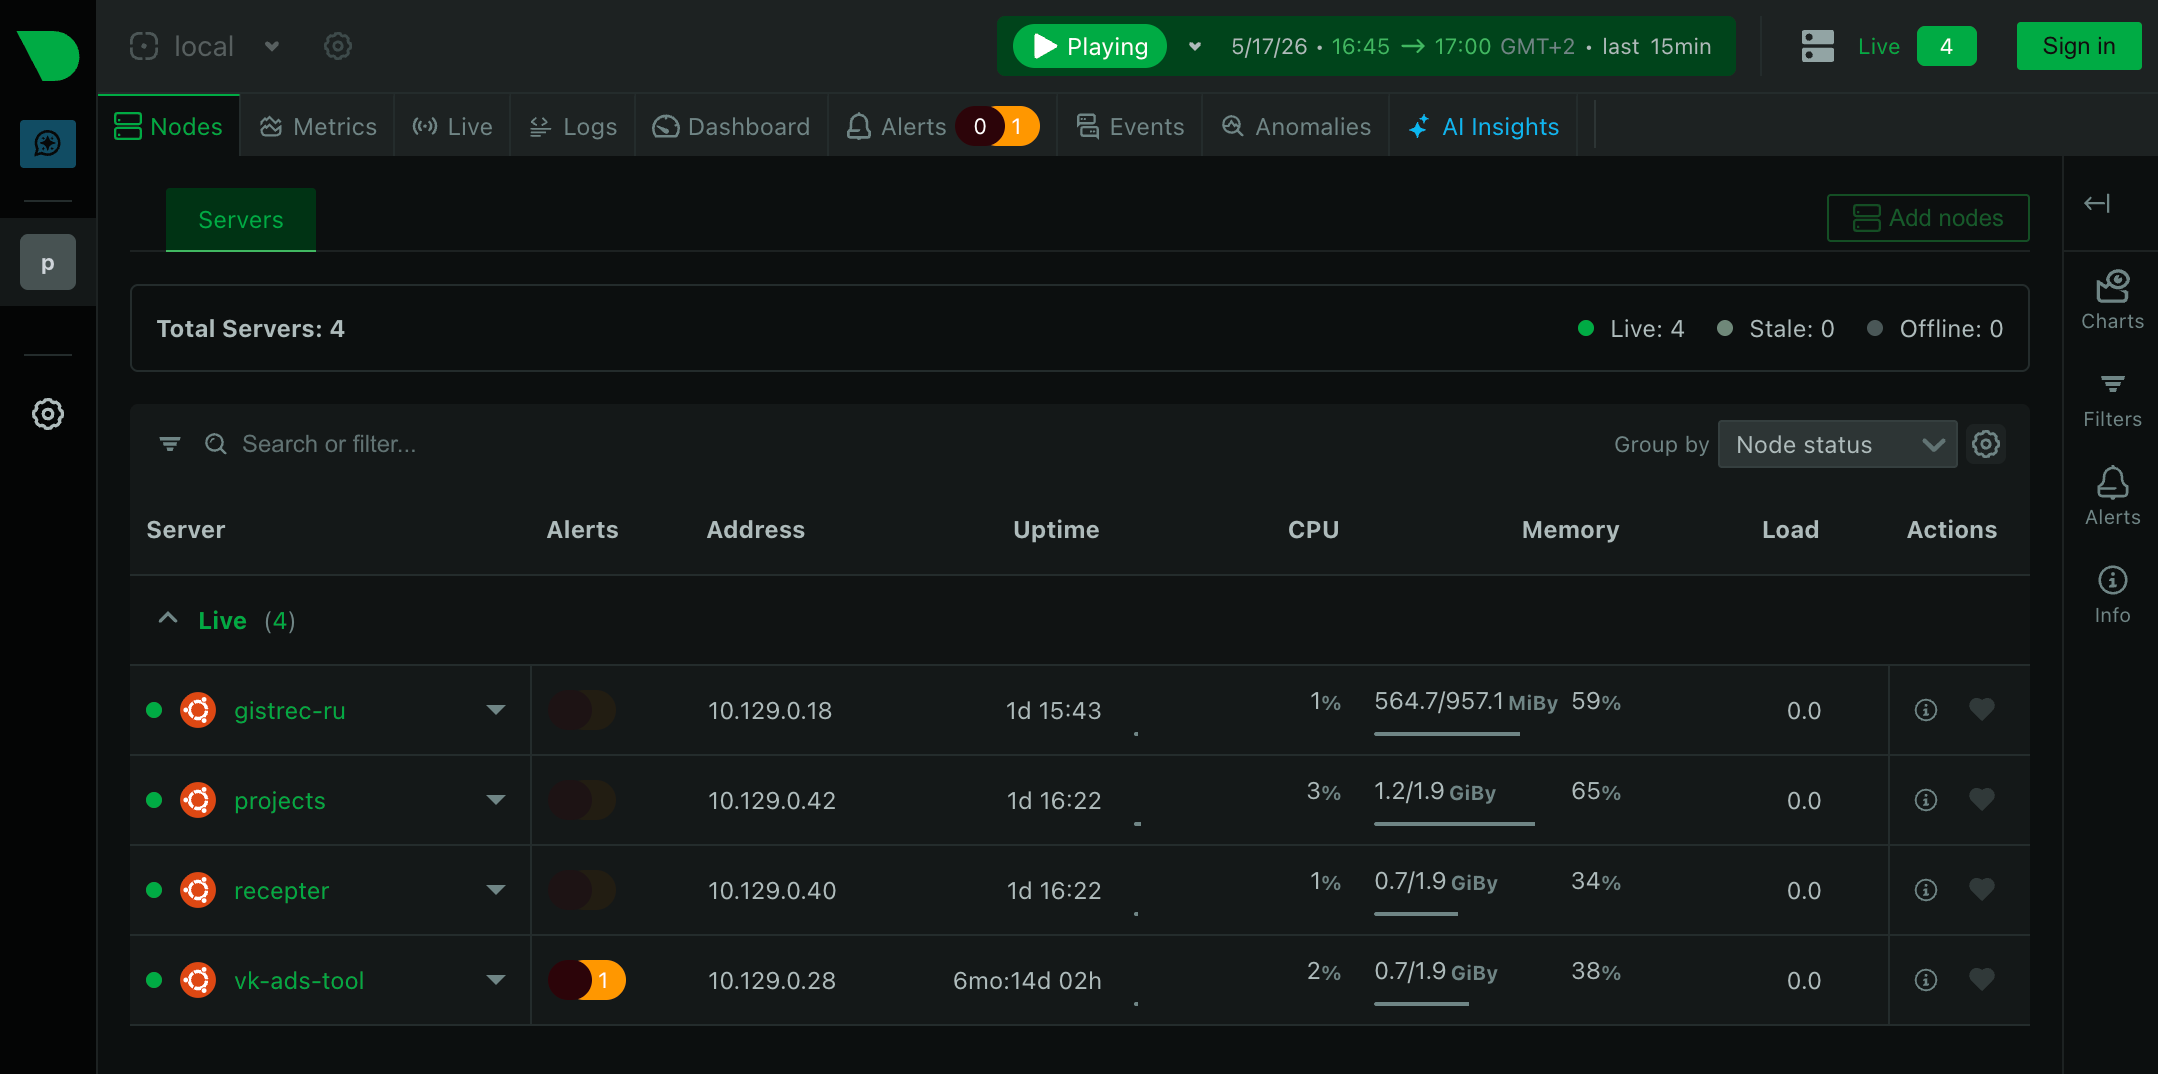
On a single server the Netdata agent collects metrics itself, stores them locally and shows the dashboard. This is convenient while there's one server. But when several VPS appear (or a DB with some Memcached), logging into each server separately becomes inconvenient.
For this Netdata has a scheme with one parent server and several child agents. Child servers collect their local metrics and send them to the parent. The parent receives these streams, stores history centrally and lets you look at the state of the whole infrastructure in one place.
                         ┌──────────────────────────┐
                         │  vps-01                  │
                         │   Netdata parent         │
                         │   30d retention          │
                         │   alerts → Telegram      │
                         └──────────▲───────────────┘
                                    │
                    ┌───────────────┴────────────────┐
                    │                                │
                 stream                       collect metrics
                    │                                │
        ┌───────────┼───────────┐          ┌─────────┴─────────┐
        │           │           │          │                   │
   ┌────▲────┐      │      ┌────▲────┐ ┌───▼──────────┐ ┌──────▼──────────┐
   │ vps-02  │     ...     │ vps-05  │ │ MySQL        │ │ ClickHouse      │
   │  child  │             │  child  │ │ cluster      │ │ cluster         │
   └─────────┘             └─────────┘ └──────────────┘ └─────────────────┘
On the parent, in /etc/netdata/stream.conf for each allowed child a section with a UUID is declared, which also serves as the API key:
[788df748-08ef-4f6b-be56-78247dec3ac5]
    enabled = yes
    default history = 21600

[9edcf9b2-cb5b-4654-b5c0-78acacbad8cd]
    enabled = yes
    default history = 21600
default history = 21600 has nothing to do with the "30d retention" from the diagram above. This is a buffer on the parent for each child (21600 seconds ≈ 6 hours), so that metrics don't get lost during short connection drops. The settings for long-term metric storage are configured in the [db] section of netdata.conf on the parent.
One UUID can be reused on several children, or you can have a separate key for each child, which lets you set different settings (for example, metric retention time) for different hosts.
On the child you need to put your stream.conf into /etc/netdata/ (the default template lies in /usr/lib/netdata/conf.d/stream.conf, I copy from there and edit):
[stream]
    enabled = yes
    destination = stats.gistrec.cloud:19999
    api key = 788df748-08ef-4f6b-be56-78247dec3ac5
After restarting both agents the child starts streaming metrics, and they appear in the parent dashboard. The alerts run only on the parent. Convenient: I tune the thresholds in one place.
When parent-child isn't needed: if you have one server or a small cluster where the built-in dashboard on each agent is enough. The overhead is small but not zero: the parent is one more component you have to watch.
Metrics of remote services
The parent server doesn't necessarily receive metrics only from child agents. It can also run collectors that connect to remote services over the network and take metrics directly.
This is convenient for managed services and separate clusters where the Netdata agent isn't installed: MySQL, ClickHouse, Redis and other services available over the network.
In my infrastructure the Netdata parent collects metrics from MySQL and ClickHouse clusters. For each service a separate collector is configured: you specify host, port and credentials, after which the metrics are displayed in the common dashboard together with the metrics of the child servers.
For example, for one of my ClickHouse clusters the config looks like this:
jobs:
  - name: clickhouse_projects
    url: https://projects.clickhouse.gistrec.cloud:8443
    username: ...
    password: ...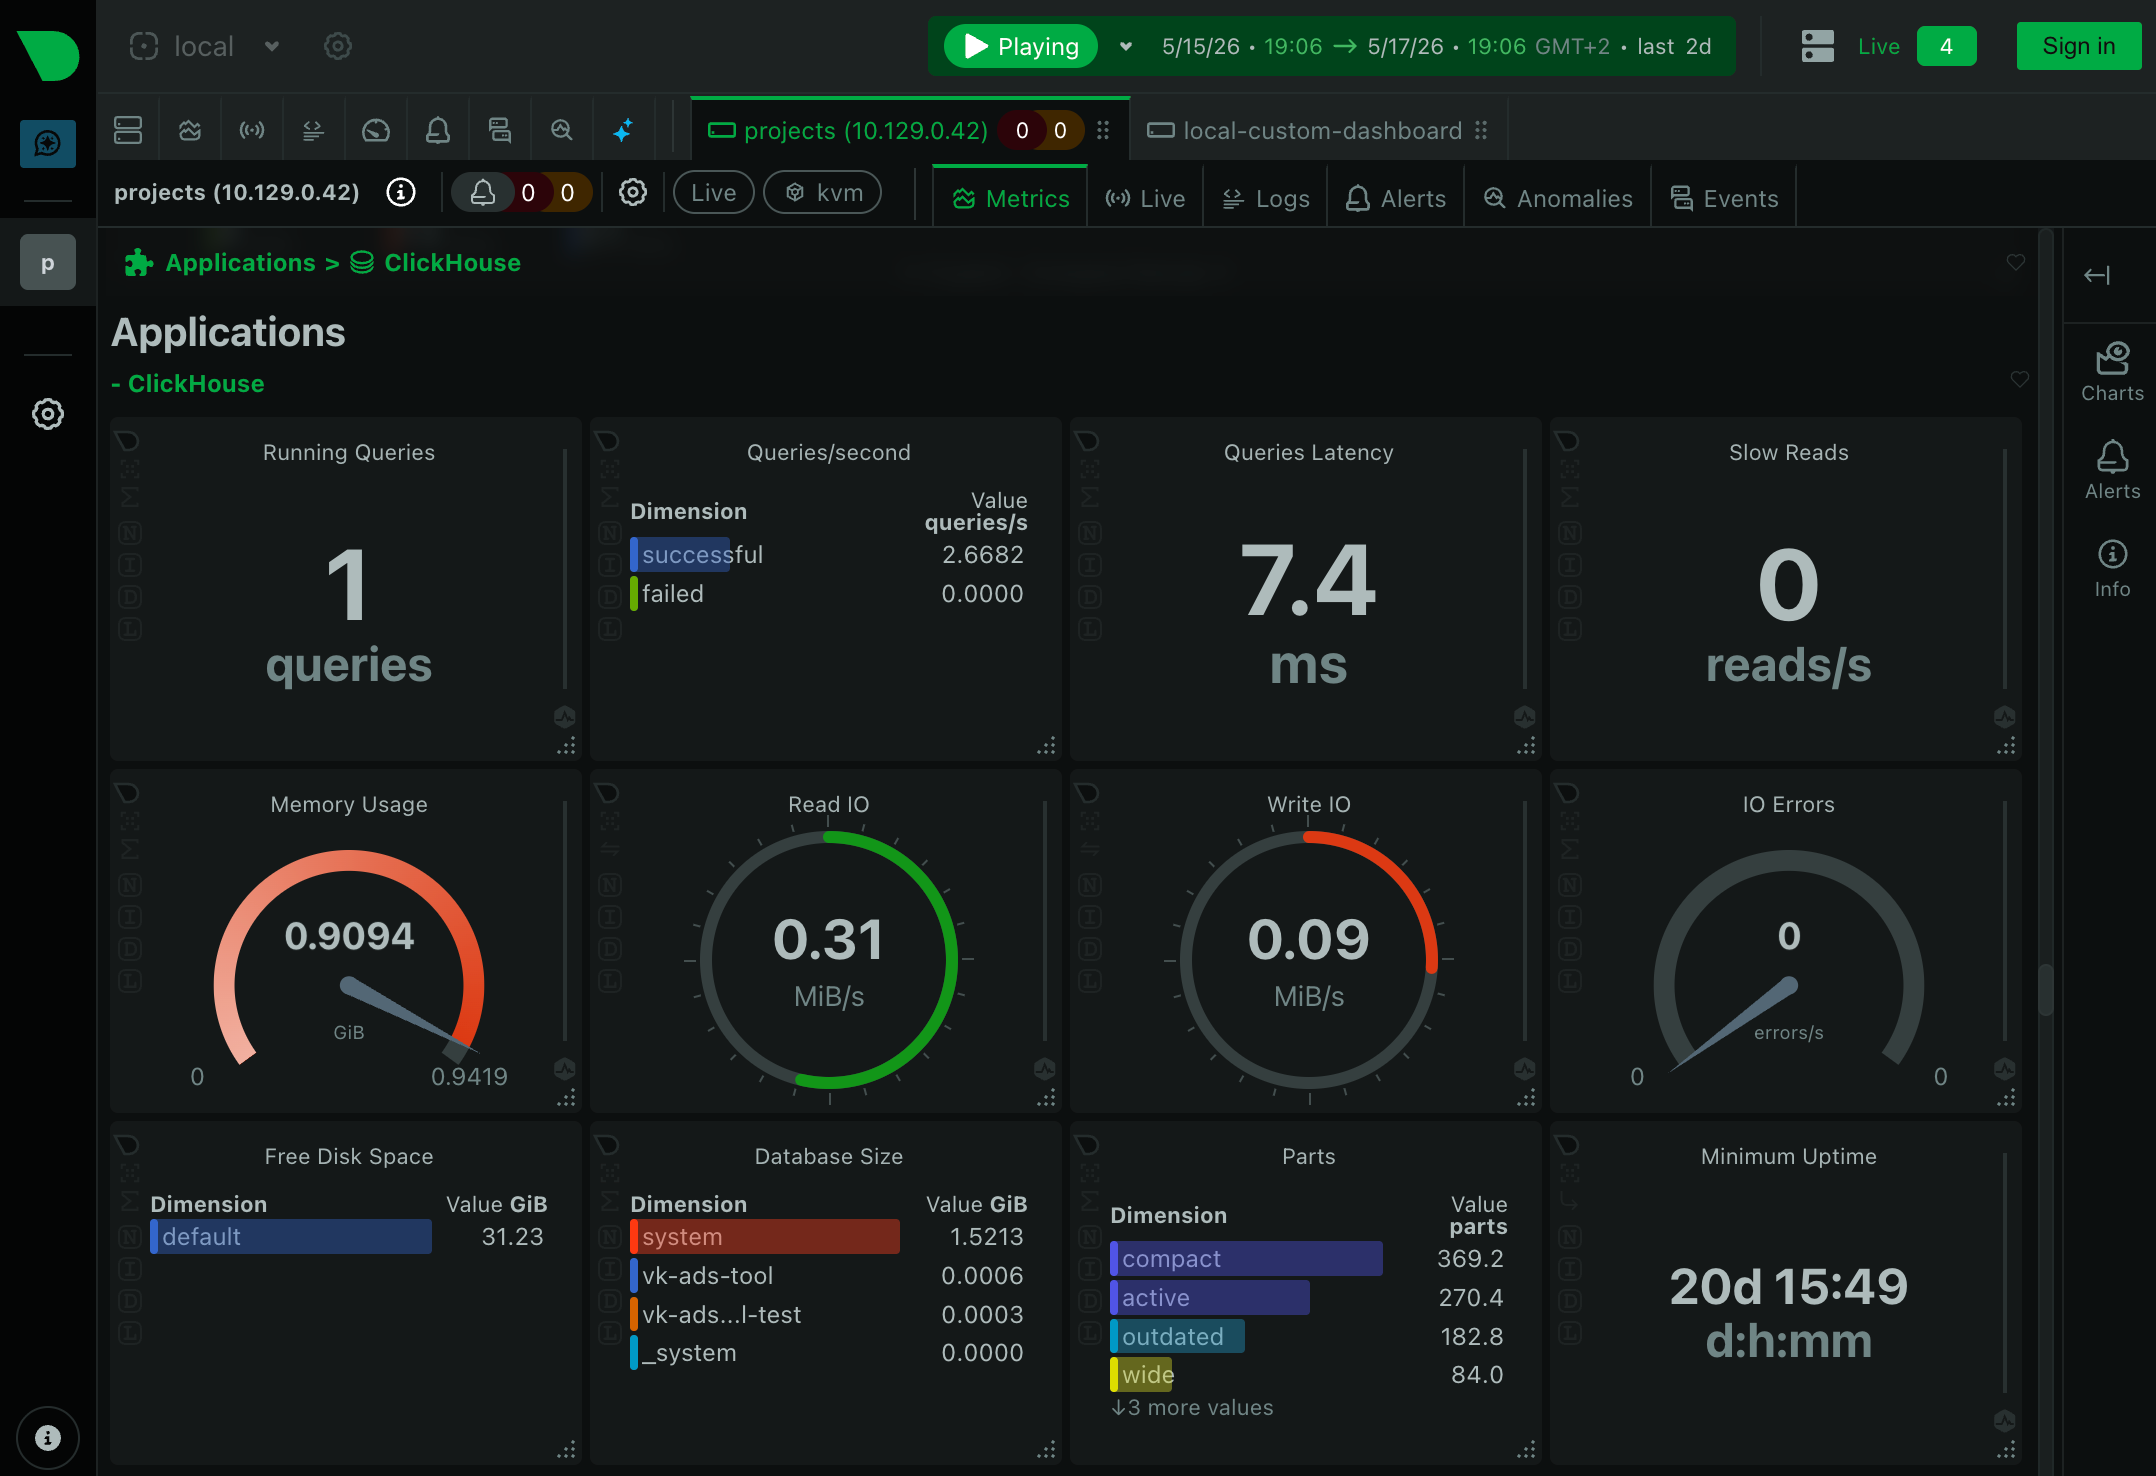
Plus Netdata can collect metrics not only from hosts, but also from services: MySQL, PostgreSQL, Redis, ClickHouse, MongoDB, RabbitMQ, Elasticsearch, nginx, HAProxy and dozens of others. Metrics and basic alerts: out of the box, without a separate exporter process.
Rakes you don't want to step on:
- Port
19999is open by default. All the data is available without login and password, so the port definitely shouldn't be opened outside. - Using all default alerts. By default Netdata includes many basic checks, but not all of them are equally important for a specific infrastructure. I disabled the collection of extra metrics (example in the config above) and picked the thresholds so notifications wouldn't be noisy.
- Reacting to every warning as to an incident. A warning doesn't mean something broke. But it's a signal that something might break soon. So muting warnings isn't a good idea either.
- Skipping regular dashboard reviews. Once a day it's useful to open the dashboard and quickly check the main metrics. Once a week, look at the alert history and tweak the thresholds for everything where there was a false-positive trigger.
If you have Linux servers but no clear monitoring, feel free to start with one server. Install Netdata, look at all the available metrics. Often already within the first ten minutes you'll see what previously stayed invisible.